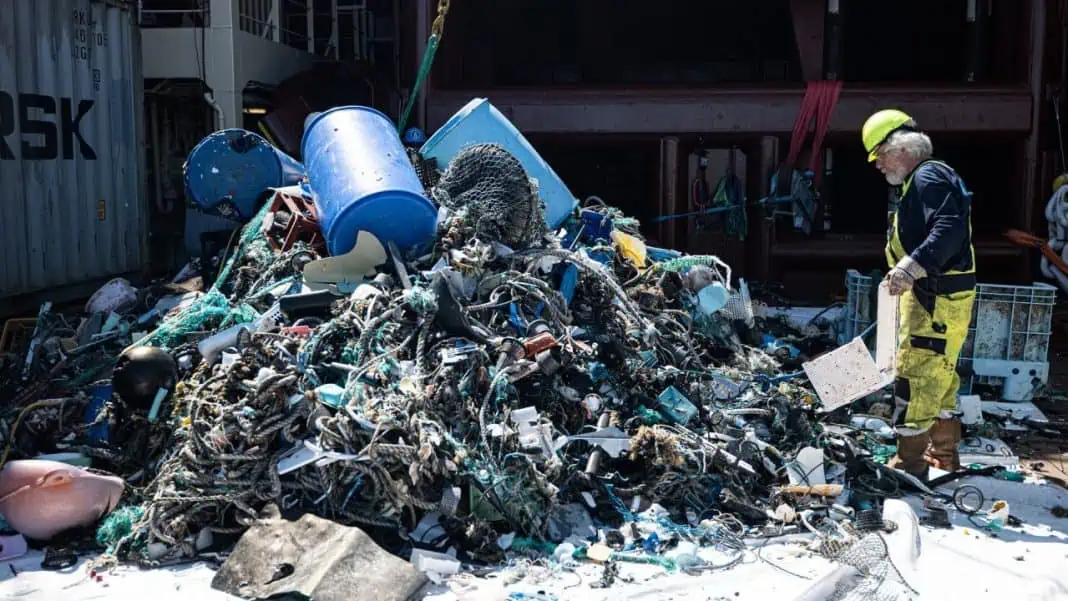
Why we must clean the ocean garbage patches by Boyan Slat, CEO and Founder, The Ocean Cleanup.
At The Ocean Cleanup, our mission is to rid the world’s oceans of plastic. To achieve this, our strategy is two-pronged: remove it from rivers and waterways that flow into the ocean, and extract legacy debris from the ocean
In my last blog I explained why we focus on intercepting plastic in rivers; we think it is the fastest and most cost-effective way to stop the inflow of plastic to the oceans. (If you haven’t read the post yet, I recommend doing so before reading ahead.)
However, we think it is equally essential to clean up the legacy pollution that has accumulated in the oceans.
When someone learns about ocean plastic pollution, the most common initial response we hear is, “Let’s just hire some ships and go clean it up!” Those who spend slightly more time delving into the issue usually come to realize that the oceans are very big, and that it would probably be much easier to find ways to prevent plastic from entering the ocean in the first place, versus cleaning it up at sea. We’ve studied the issue for years, yet here we are, working to clean up plastic directly from the oceans.
Why? Let me explain.
THE PROBLEM IN A NUTSHELL
Every year about a million tons of plastic pollution enter the world’s oceans. Most of it comes from rivers. Of this plastic, the majority only stays afloat in the ocean for a brief period of time.
Because about half of this plastic floats, a substantial amount of trash quickly sinks into the sediment. According to our modelling, within one month, more than 80% of what remains afloat has the potential to beach on a coastline not far from where it entered the ocean. And within one year, 97% might end up back on land. At this point, only a tiny fraction of plastic emissions appears to be ‘lucky’ enough to escape the grip of coastlines and make it to the open ocean. However, once the plastic finds itself in the open ocean, we can expect it to stay there for a very long time.
Plastic accumulates in five areas in the world’s oceans, known as the subtropical oceanic gyres. Basically, these are vast circular currents that trap the floating trash inside of them. This is where the five ocean garbage patches can be found.
The ocean garbage patches are the planetary equivalent of the corner of your room to which you swept all the mess you left on the floor. The most polluted – and best-studied – of these is the infamous Great Pacific Garbage Patch (GPGP) located between Hawaii and California. The GPGP only covers about 0.5% of the world’s ocean surface, yet is estimated to contain more than 50% of all the plastic mass floating in the open oceans.
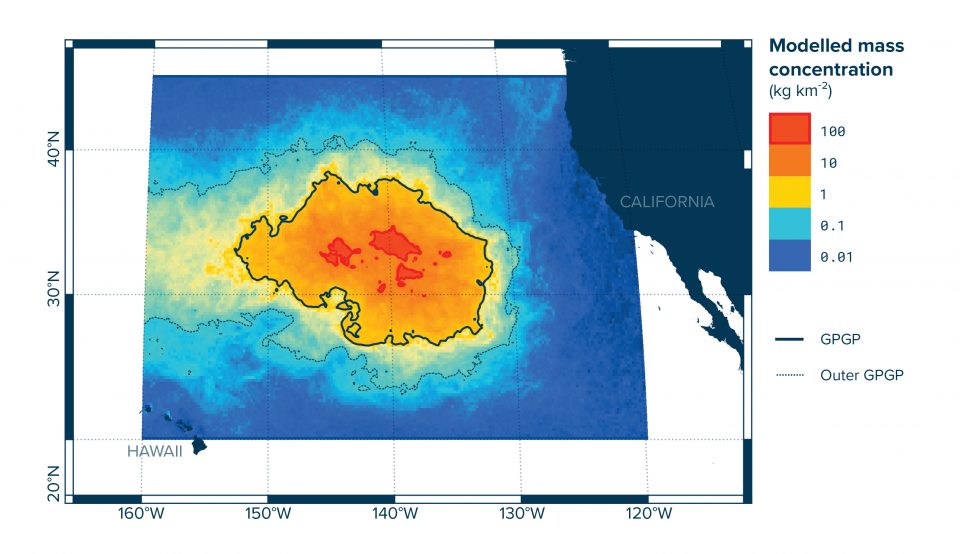
The Great Pacific Garbage Patch (GPGP), as mapped by The Ocean Cleanup in 2015-2016.
The word ‘patch’ is a bit of a misnomer, though. These accumulation zones are not islands of tightly packed trash, as they are sometimes portrayed in news reports. If only this were the case – cleanup would be so much easier! Instead, the trash is spread out over vast areas. In the GPGP, the average density of plastic is roughly the weight of one soccer ball for every soccer field worth of ocean; not exactly close to something you can walk on.
However, because these patches cover such a large area (the GPGP spans a piece of the ocean larger than France, Germany, and Spain combined), all these ‘soccer fields’ add up to vast amounts of pollution. The GPGP now contains an estimated 100,000,000 kilograms of plastic. Associated with this plastic are all the well-known impacts of plastic pollution on ecosystems, human health, and economies. In fact, nowhere else is the ratio between plastic and naturally occurring prey as high as in the ocean garbage patches, ingestion risk for marine life (as well as the associated chemical effects) are likely highest here.
Still, you may rightly ask: why should we bother with cleaning up these areas if, pound for pound, it’s bound to be cheaper and easier to collect trash in river mouths? Wouldn’t it be enough to cut the source, as is the case for smog, for example? And why start with it now, rather than wait for the inflow to be solved first?
To answer these questions, it is vital to understand two things:
1. Plastic in the ocean garbage patches is highly persistent
2. Floating plastic becomes more harmful over time
A PERSISTENT PROBLEM
In short: we can only return to clean oceans if we clean up the ocean garbage patches. Stopping the source will prevent more plastic from entering the oceans. But the only way to reduce the amount of plastic across the ocean is to actually go out there and clean it up.
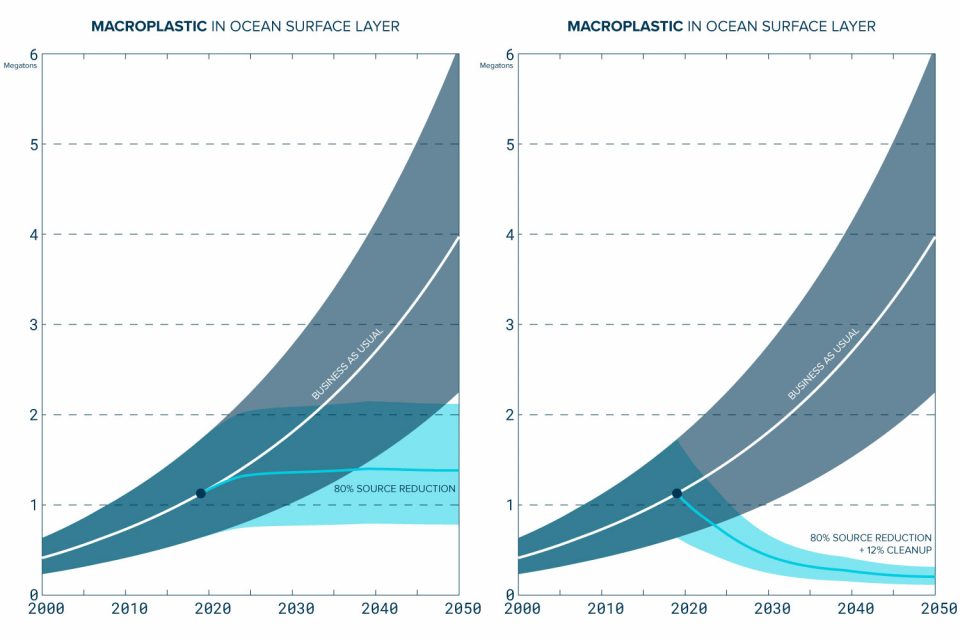
Future scenarios for macroplastics in the GPGP. The dark band shows what would happen without any change. Addressing the source (left) causes the amount of ocean pollution to stay constant. Combining source reduction with cleanup (right) causes the amount of ocean pollution to decline.
The reason for this is that plastic pollution is persistent. Imagine the condition/scenario of a bathtub that is overflowing. For a nonpersistent pollutant scenario, merely closing the tap is enough to solve the problem. But in the case of a persistent pollutant, one also has to mop up the overflow on the floor.
This is why Londoners today don’t suffer anymore from the soot emitted during the Great Smog of 1952. Yet, it’s still unhealthy to consume fish from the San Francisco Bay due to PCBs emitted in that same year. Soot is not a persistent pollutant, while PCBs are. It’s why smog problems in wealthy countries have reduced considerably since the 1970s and why plastic pollution isn’t like smog.
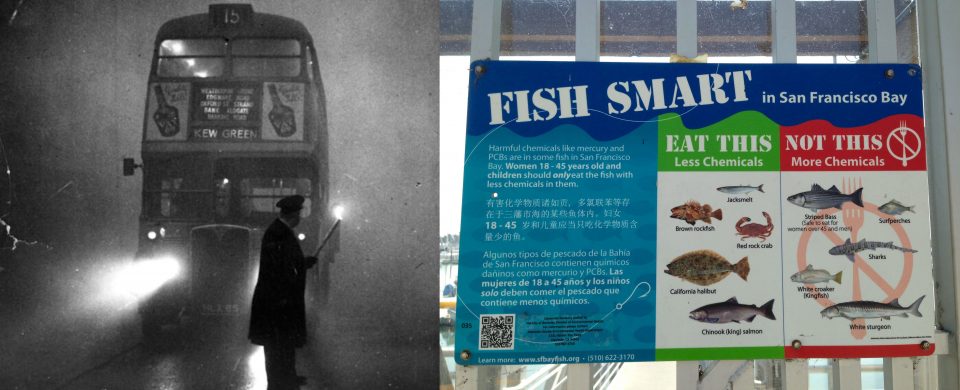
Two kinds of pollution. Left: the Great Smog of London, 1952. Right: PCB pollution in the San Francisco Bay
Plastics are incredibly stable and durable. This is good if you want to make lasting products (or fake diamonds), but it’s problematic if it ends up in the environment. During our most recent expedition to the GPGP, the oldest object we found with its production date still identifiable was a buoy from 1966.
Might this observation have been a fluke? An object that was stored indoors for decades and only recently entered the oceans? Probably not. Our researchers have analyzed many dozens of recovered objects from which we could identify the production date. Suppose the old items we find are exceptions. In that case, we’d expect those older objects to be exceptions in our catch, between a bulk of more recently produced objects. Instead, we find that the age distribution of plastic in the patch neatly overlaps with the plastic production trends of the last 60 years. About half of the plastic we could identify has a production date from the 1990s or earlier. These findings are a strong indication that all this plastic has been gradually accumulating in the patches and does not leave.
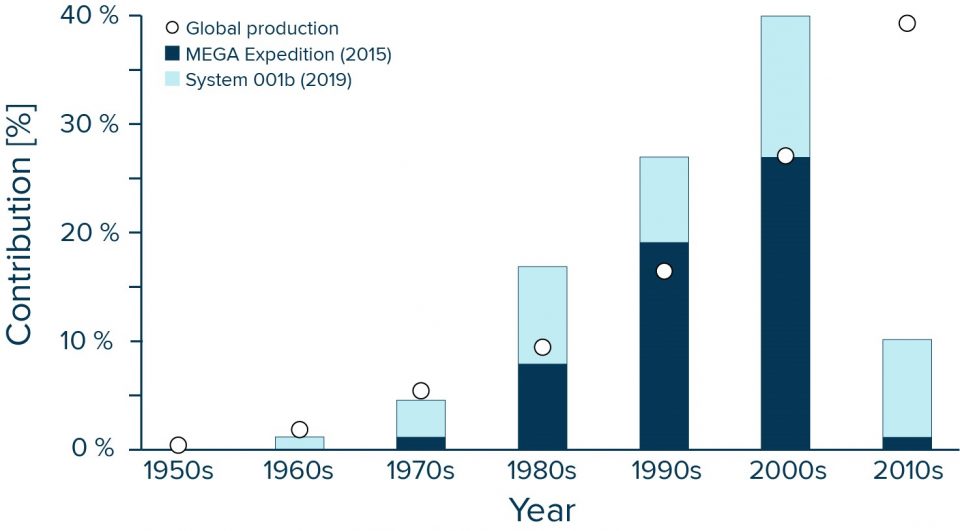
Identifiable age markers on plastic recovered during the Mega Expedition. Note that it takes, on average, seven years for plastic to travel from coast to the GPGP, which explains why we found so little plastic from the 2010s in 2015.
Recent lab experiments support this conclusion. A Dutch team recreated the ocean environment in the lab and measured the degradation of various plastic objects over time. They found that the weight loss of plastic items typically observed at sea is less than 1% per year. Other experiments used strong UV lamps to accelerate the degradation process, which indicated that polyethylene (the most common type of plastic in the ocean) might take “up to centuries” to fully degrade.
Besides degradation, plastic can leave the patch if it gets spewed onto a coastline. This, however, also seems to be a rare occurrence. The only shorelines close to the patches are remote islands. For example, under 100 tons of trash is estimated to escape the GPGP and wash up on the Hawaiian Islands every year. This is an impressive amount, but it is only 0.1% of the mass of the whole GPGP.
Clearly, these ocean garbage patches are not going away by themselves in any reasonable frame of time.
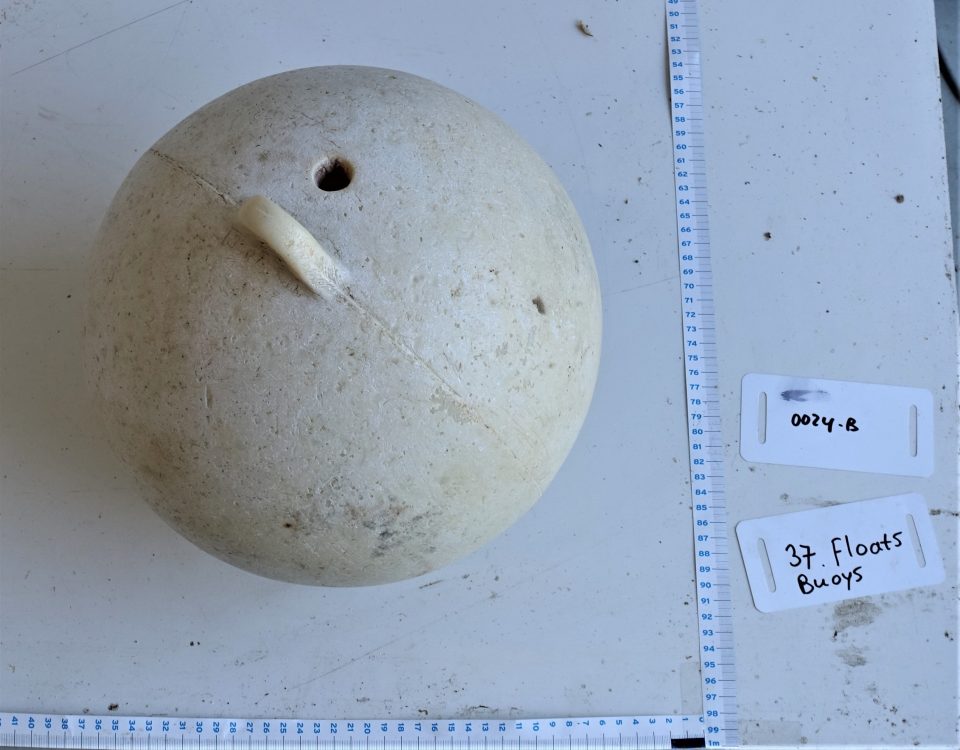
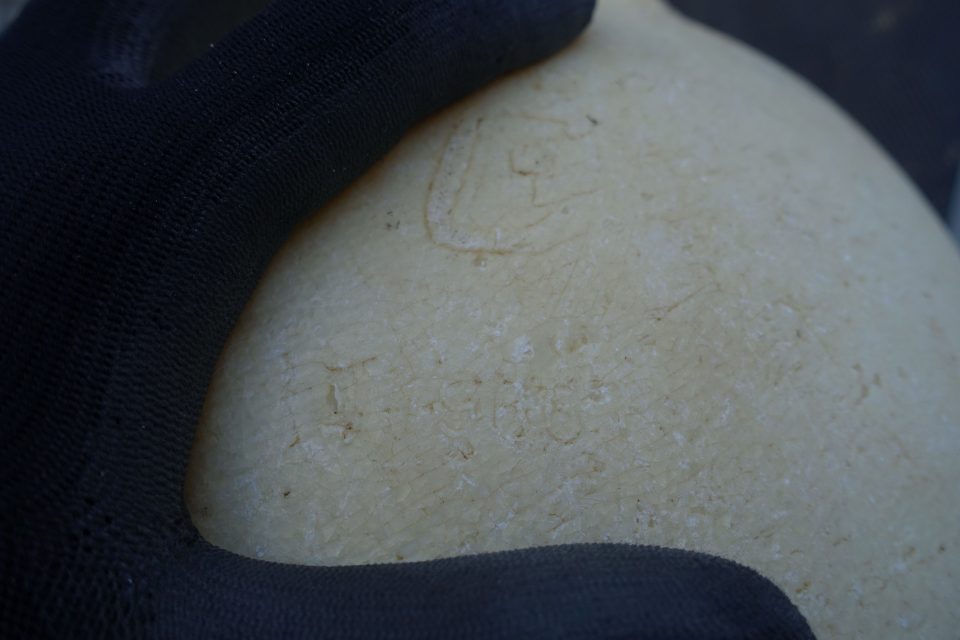
1/2 Buoy caught in the Great Pacific Garbage Patch, with the production year 1966
A TICKING TIME BOMB
A lot of plastic is still entering the oceans every day. And if I could choose, I’d prefer to catch a piece of plastic before it enters the ocean than wait for it to have accumulated in the middle of the ocean. So why not just focus on closing the tap now, and worry about cleaning up the patches later, once the plastic inflow has been halted?
The obvious answer to this is that the sooner the patches have been cleaned up, the sooner they stop causing harm. Less obvious is the fact that the longer we wait, the more harmful the accumulated plastic becomes. While the true degradation of plastic into harmless compounds is predicted to take centuries, the sun and waves do break down the objects into smaller and smaller pieces over time. For example, a single crate will ultimately turn into hundreds of thousands of microplastic particles. Every piece of plastic has the potential to cause damage, so the higher the plastic count, the greater risk of harm the plastic might pose to the oceans.
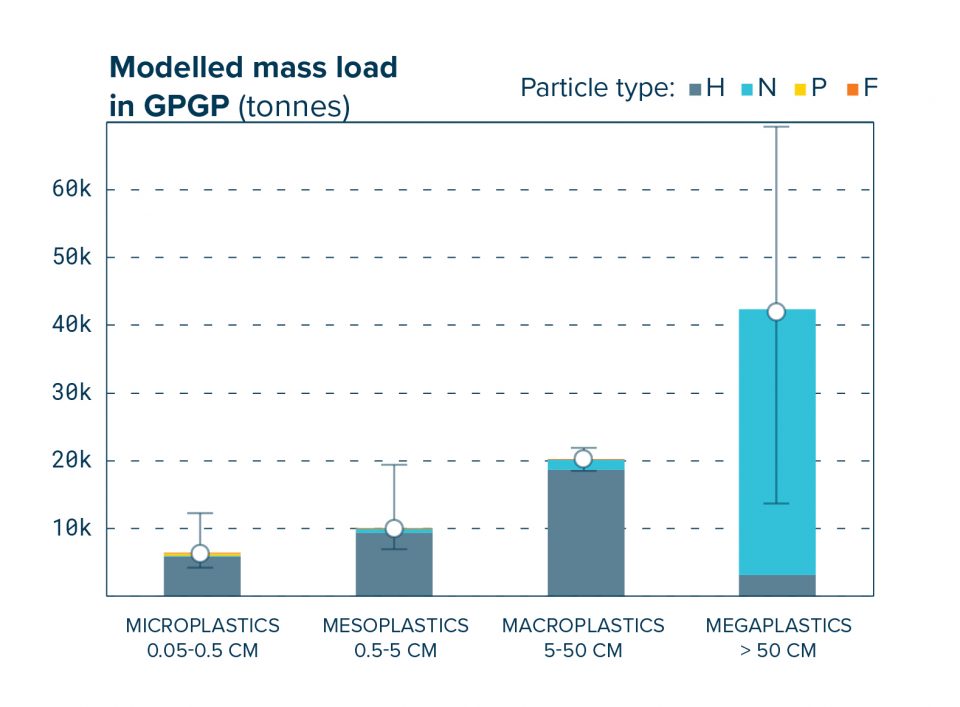
Composition of the inner GPGP. Currently, about 5-10% of its mass is microplastics.
At the moment, about 5-10% of the plastic mass in the GPGP is microplastic. On the one hand, this is good news; it means most plastic hasn’t fragmented into microplastics yet. But it also means that the number of microplastics might increase by a factor of 10 or more if we don’t remove the plastic floating in the oceans today. The longer we wait with the cleanup, the more microplastics there will be in the oceans.
What’s more, plastic doesn’t only become more harmful over time, it also becomes harder to clean up. The smaller the pieces become, the less buoyant they are. In 2019, our researchers crossed the GPGP and took measurements from the surface down to 2000 meters of depth. Under the patch, we found that it was snowing microplastics. The concentrations of this fallout are tens of thousands of times lower than those we see at the surface. The amount of microplastics we found suspended in the deep sea represents less than 10% of the total mass of plastic in the patch. Still, if we don’t remove the surface plastic, we may expect that eventually most of this other 90% will also end up under the surface.
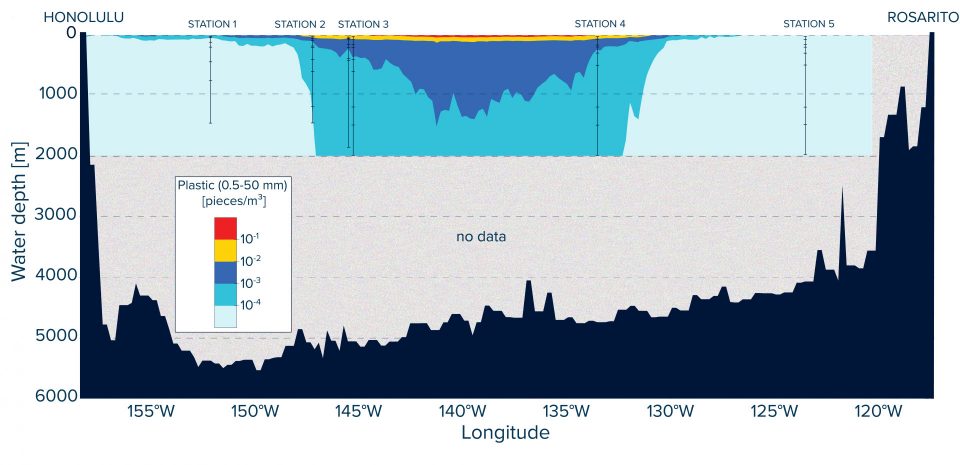
Cross section of the Great Pacific Garbage Patch. Left, Hawaii. Right, the North American West coast. Note the color scale is logarithmic.
This is a crucial point. By cleaning up the surface waters of the ocean garbage patches now, we can prevent a 2D problem from becoming a 3D problem. At this moment, most plastic is in the upper two meters of the ocean. If this plastic disperses throughout the top 2000 meters, the volume of water we would need to clean increases a thousandfold. In other words, the effort required to clean a vertically dispersed patch would be like cleaning up today’s ocean garbage patches a thousand times! So we have a brief window of opportunity to take care of the legacy plastic before it turns into microplastics and pollutes the entire water column for an indefinite duration.
From this perspective, one might argue that cleanup is prevention too. By removing the floating trash now, we prevent this trash from doing further harm and becoming almost impossible to eradicate.
A NECESSARY INGREDIENT
If I could choose, I’d rather catch plastic with Interceptors in rivers than with ocean cleanup systems. Unfortunately, it’s too late for the hundreds of millions of kilos of trash that already pollute the ocean today. Stopping plastic before it reaches the oceans allows us to keep the amount of plastic in the oceans constant, but the only way to reduce the amount of ocean plastic is to clean up that legacy pollution. That’s what we need to do to truly rid the oceans of plastic.
One can debate what the optimal resource allocation is between different removal activities. I agree with those who argue that the majority of resources aimed at solving plastic pollution should now go to stopping the inflow. Yet, that doesn’t mean we should only do one or the other. Humanity works on eradicating diseases, solving climate change, reducing poverty and improving education in parallel. Clearly, humanity can do more than one thing at the same time.
Returning to the analogy of the overflowing bathtub: here, an optimal strategy might be for a few people to work on trying to close the tap, while one person starts to mop the floor.
You see this parallel approach after an oil spill; some workers attempt to stop the leak, while in parallel, others try to clean up the pollution that has already been leaked to prevent further harm to the ecosystem. Similarly, the prevention and cleanup of ocean plastic can, and should, be applied in tandem.
Cleaning the ocean garbage patches will not be easy. System 002 is currently undergoing testing in the GPGP, and first results look promising. Still, success is not guaranteed. Even if System 002 proves its effectiveness in the next few weeks, there is still a complex journey ahead to scale it up.
All I know is that it’s worth trying.
REFERENCES AND NOTES
- It is estimated that about 20% of plastic entering the oceans is coming from maritime sources, i.e., vessels, fishing and aquaculture. Hard data on this is lacking, so it is a topic our research team is investigating. ↩
- Of the fraction that floats in theory (i.e., objects made from PE and PP), part is still likely to sink if their surface-to-volume ratio is high, such as is the case with plastic bags. We hardly find any plastic bags in the middle of the ocean, while plenty can be found in rivers and on the seabed near the mouths of rivers. Just a tiny bit of algae or sediment is enough for bags to go under. Note thin-walled objects like bags will also be more prone to UV degradation, so will also break down into microplastics quicker than thick-walled objects like bottles, crates, and toothbrushes (which, unsurprisingly, are common finds in our catch from the GPGP). ↩
- We suspect this largely explains the Missing Plastic Problem. However, more research is needed to reach consensus on this. ↩
- Buoyancy, degradation speed and the location of entry are all important variables determining the odds for plastic to make it offshore. But there appears to be another one: wind. Debris that sticks out of the water more is much more likely to be pushed onto a coastline than debris that doesn’t. We believe this explains why we find a lot of buoys and Styrofoam blocks on the Alaskan coastline, while the trash inside the GPGP is barely affected by wind. ↩
- Trash emitted by vessels and fisheries is less likely to beach, so it has a much higher probability of reaching the ocean garbage patches versus plastic fed from land-based sources. This explains why the majority of plastic in the ocean garbage patches comes from vessels and fisheries, not from rivers. ↩
- The GPGP probably is the most polluted one due to a combination of three factors: intensive fishing activity in the North Pacific, a huge proportion of the world’s population lives in East/Southeast Asia, and many of the countries in this region are middle-income, which is where we see the most plastic leakage. ↩
- We measured the GPGP to contain about 100 million kilos of plastic. There is high uncertainty around the numbers of the other patches as robust datasets don’t exist yet. We estimate that the other four patches jointly contain roughly 75 million kilos of plastic. ↩
- Mapping the patch in the early days of The Ocean Cleanup meant crossing the patch with about 30 boats simultaneously, followed by several aerial crossings using an airplane. Then, we had a group of interns count 1.2 million pieces of plastic by hand. It was a crazy project and I still look back on it with a lot of pride. ↩
- There are a few more impacts unique to the ocean garbage patches. a substantial proportion of the plastic in the ocean garbage patches is lost or discarded fishing nets, which are not only very hazardous to marine life, but also to mariners. On several occasions, our own vessels have become victims of blocked propellers and rudders. On large vessels, this is usually a costly nuisance. On smaller boats, this can be lethal. Next to this, floating plastic has the capacity to transport invasive species over vast distances, passing many different ecosystems. This is relevant as some scientists believe invasive species are currently the main cause of species extinctions. ↩
- I’m of course referring to reasonable timeframes relevant in the context of a human‘s lifespan. If we wait long enough (centuries), eventually all plastic in the ocean garbage patches will have fragmented and will slowly disperse into the water column. But, as we will see in the next section, that’s not exactly a great outcome either. ↩
- Humanity will be facing a similar situation with CO2, a very persistent greenhouse gas. One thing is to stop emissions; another is to remove the excess CO2 from the atmosphere. ↩
- We find the average weight of a piece of microplastic to be 0.00353 grams if it has size range between 500 microns and 5 mm (Lebreton et al., 2018). If a crate weighs 2 kg, this would result in almost 600,000 pieces of microplastic of this size. ↩
- The general trend seems to be towards more potential for harm when plastic fragments. Larger ghost nets may be an exception to this, as they pose an entanglement risk. ↩
- There is also a minimal size threshold that can be cleaned up. We may be able to collect the larger microplastics, but the ones smaller than 1mm are predicted to pass through the cleanup system. ↩
- As Toby Ord explains in The Precipice, maximizing our options is one of the most important goals to strive for as a species. Having plastic dispersed throughout the water column of the world’s oceans has a strong lock-in effect, and deprives us of the option to ‘turn back time’ on the problem. ↩
- To use economics lingo, it’s all about maximizing expected value. In any case, cleaning up the patches seems extremely good value for money. This study estimates the societal cost of ocean plastic at USD $3,300-33,000 per ton per year. Even if the plastic in the patches would only last 30 years, the damages prevented per ton of plastic removed would equal USD $100,000 to USD $1 million. ↩


